"Imagination is more important than knowledge." Albert Einstein
"Never memorize something that you can look up." Albert Einstein

jueves, 4 de abril de 2013

Experiment 6: Vapor pressure on alcohol


Objective: (Angela)
  • Learn how to make an alcohol molecule (pentanol).
  • Calculate the pressure of the alcohol (pentanol) while creating a vacuum and using a pressure sensor.
Background:
Video 1: Background on pentanol. (Concha)

Video 2: Background on the schlenk line (Irene)


Materials: (Angela)
- Certain alcohol (in our case is pentanol).
- Pressure sensor.
- Interphase.
- Laptop.
- Schlenk tube.
- Rubber bands.
- Clamp. 
- Stand.
- Vaseline. 

Procedure: (Ana)
1.- Cover the top of the schlenk tube with vaseline in order to avoid any possible mistakes creating the vacuum.
2.- Fill the lower part of the schlenk tube with certain alcohol (in our case, pentanol).
3.- Close the schlenk tube.
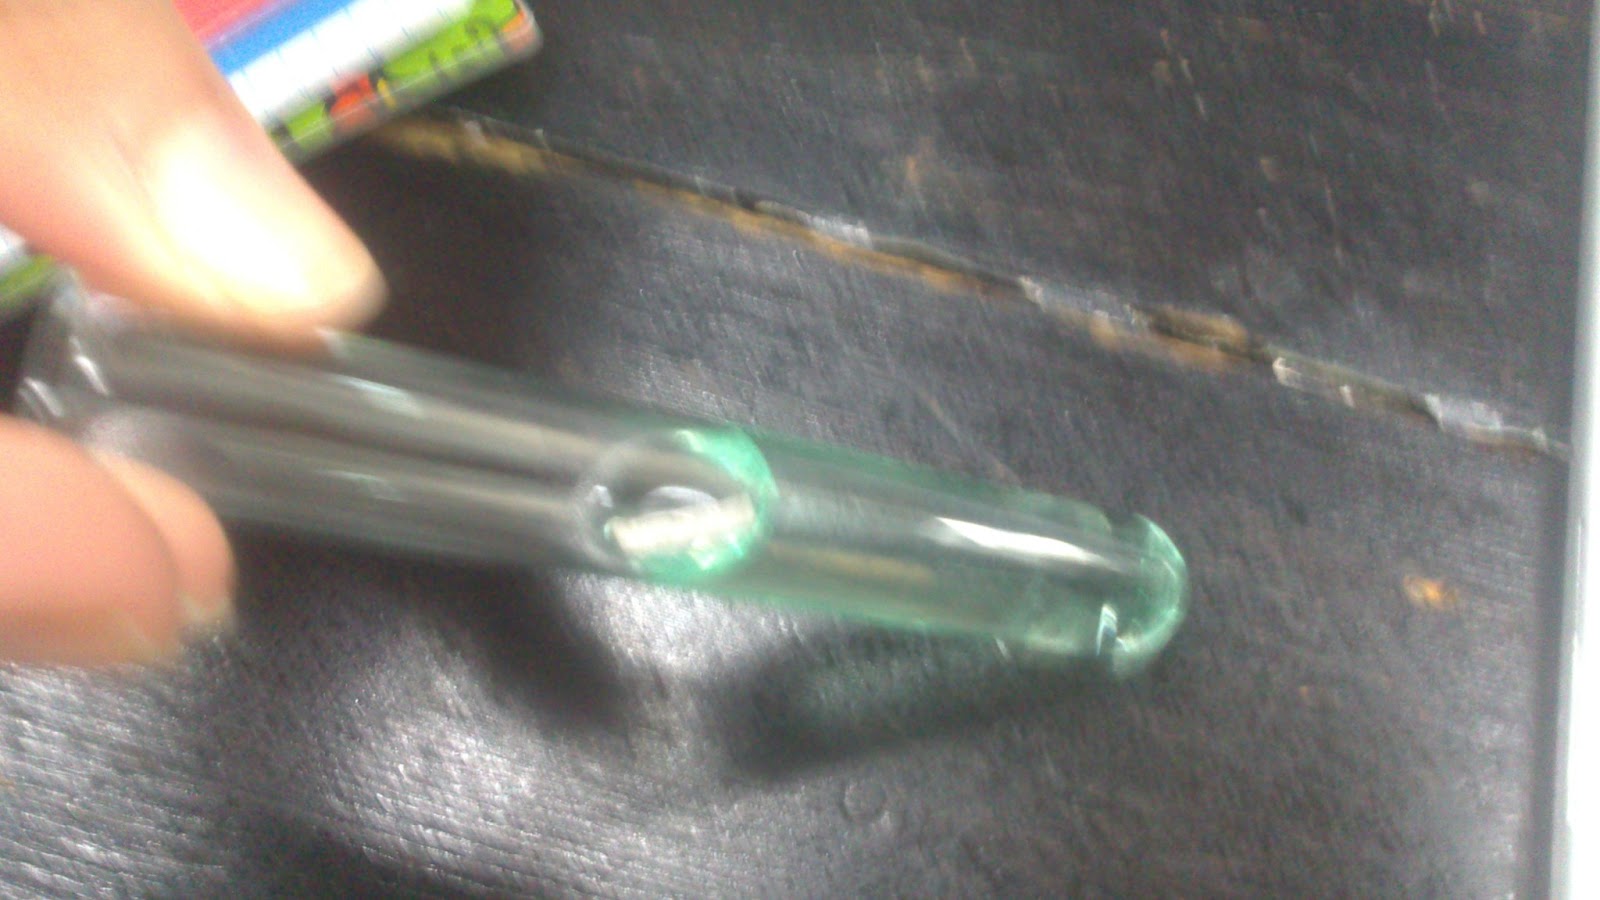
4.- Grab a rubber band and use it to ensure the schlenk tube remains closed putting it around it as shown in the images below:

5.- Join the rubber band and the gas sensor using the interphase.
6.- Open the Logger Pro in the computer.
7.- Join the rubber tube to the schlenk tube and the gas sensor to the laptop.
8.- Now, using the vacuum tube, create a vacuum inside the schlenk tube and don't stop until you see some bubbles.
9.- Collect the data using the computer.

Video 3: Procedure of the experiment (Ana)


Collecting data:


Table 1: table showing the relation between the different components depending on their number of carbon atoms and the pressure in kPa. (Ana)

Graph 1: graph showing the relation between the Pressure (in kPa) and the number of carbon atoms in each component. (Angela)


1-Pentanol molecule: (Concha)
During the lab experience we had the chance to create the pentanol molecule using small plastic balls made to model molecules. 
The black ones represent the carbon atoms of which we had 5, the white ones stand for hydrogen atoms of which we had 12 and the single red one is an oxygen atom.
The aim of this GIF is to show the different shapes in which we can find the molecule from the most streched positions to the smallest posibles obtained from twisting and turning the small plastic balls. We think that this GIF will allow us to show better one of our conclusions. As we can see in the series of images of the pentanol molecule, this model of the molecule does have flexibility meaning it is not fixed in a single position (appart from the fact that in other forms of pentanol the OH can be found in other places). As in this model, the real molecule of pentanol, does not have a fixed shape so it is also flexible.
GIF: done by Irene -->


Conclusion: (Irene)
While performing the experiment we observed that liquids exerted a pressure and that different alcohols produced different gases with different pressure, each alcohol has a different vapour pressure. We have found that this is because of the volatility of the alcohols. Alcohols are volatile compounds as they are organic compounds and volatility is defined as "the tendency of a substance to vaporize or the speed at which it vaporizes" (Epa.gov, 2000) meaning that the substances with a higher vapor pressure will be more volatile and the ones with lower vapor pressure willbe less volatile this happens because the ones with higher vapor pressure have less carbons therefore it's easier for them to brake their bonds and vaporize while the ones with lower vapor pressure have more carbons and won't be so willing to vaporize as it's harder to brake their bonds.
We also deduced from the results obtained that as more carbon atoms the molecules have the lower the vapour pressure is.
As we comented before  when talking about the pentanol molecule, the fact that we saw different shapes means that the alcohols molecules are flexible, they addopt different shapes. This can be applied to all alcohol molecules as they are all composed by hydrogen, oxygens and carbons and are joined by covalent bonds, they form an homologus series (series of elements with the same characteristics, structure). From the structures of the different alcohols we deduced that they follow a pattern, for every carbon atom there are two hydrogen ones except for the ones in the ends which have three, we could representate it as the following where the n stands for the number of carbon atoms:


video: (Angela)

Conclusion on the graph: (Concha)
As we can see the best fitting line of the graph is a potential one. Now the question is, why? Well, the anwser is simple: the potential best fitting line fits better for this values than the rectilinear one, but again, why? 
Usually, we say that in a rectilinear movement when a variable increases by a fixed amount, the other variable increases or decreases, depending if the relation between them is directly or indirectly proportional, a fixed amount too. The division of the difference within the points of each variable is called slope which is given by the formula beneath:
                                         Slope Formula
In potential functions this changes. The easiest way to explain this is with the uniformly rectilinear movement and the uniformly accelerated rectilinear motion equations. 
                  
As we can see, the first formula corresponds with what is said in the second paragraph of this conclusion. Meanwhile, the second formula does not. This formula is a potential function and so the best fitting line will be curved. 
As we can see the last two components of the equation resemble the uniformly rectilinear movement equation so the difference must be in the other component of the equation. The addition of this third component leads to a change in the progression of the values. With this third component, instead of increasing a fixed amount, as one variable increases a fixed amount, the corresponding values of the other variable will increase more each time. An easy example we can observe in real life is when an object falls to the ground. The velocity of this object increases more and more with each second that goes by and so the resultant best fitting line will be exponential.

Evaluation (Concha):
Now, if we look back to our performance of the experiment we could list some strong and weak points of it so, in case we have to repeat it, we will know what we did wrong and how to improve it.
First of all, I think that one of our strong points is that as the performance of the experiment was dispensed between all the members of the class, we all learned how to perfom this kind of experiment, the theory behind it and how to use the equipment involved in it. In addition, I think that we followed all the steps with great ability as our result is not far from the best fitting line shown in the graph. In general, I think that all the groups did a great job beause the points that are not in the path of the best fitting line are not far from it.
On the other hand, I think that one of our weak points and the cause of our result not being in the path of the best fitting line is that we didn't added enough vaseline to the schlenk tube and therefore we didn't created a complete vacuum. Next time we perform this experiment we will add more vaseline in order to achieve a more accurate result.
In conclusion, I don't think we performed a bad experiment due to the fact that the part of the data we collected is not far from the best fitting line.

References: (Irene)
En.wikipedia.org (1891). Amyl alcohol - Wikipedia, the free encyclopedia. [online] Retrieved from: http://en.wikipedia.org/wiki/Amyl_alcohol [Accessed: 4 Apr 2013].

Epa.gov (2000). Respirable Particles | Indoor Air | US Environmental Protection Agency. [online] Retrieved from: http://www.epa.gov/iaq/voc2.html [Accessed: 1 Jun 2013].
Zeably.com (2012). Pentanol Pictures and Images. [online] Retrieved from: http://www.zeably.com/Pentanol [Accessed: 4 Apr 2013].

sábado, 23 de febrero de 2013

Experiment 5: Gas Law Apparatus.


Objective: to determine how the pressure changes depending on the volume maintaining the temperature as constant as possible.

Background: 
There are three main gas laws which are combined to form the ideal gas equation. One of these three laws is applied in this experiment. But , first of all, what is an ideal gas?
An ideal gas is a hypothetical gas formed by identical particles of zero volume, with no intermolecular forces.
Charles' - Gay Lussac law: in this one, we maintain the pressure constant and we change the temperature and volume. "At constant pressure, the volume of a fixed mass of gas is a linear function of temperature".
Gay - Lussac's law: in this one, we maintain the volume constant and we change the temperature and pressure. "At constant volume, the pressure of a given mass of gas is a linear function of temperature"
Boyle - Mariotte's law: this is the one used in the experiment. In this one, we maintain the temperature constant and we change the volume and pressure. "For a fixed mass of an ideal gas at cosntant temperature, the product of pressure and volume is a constant".


Variables:
Independent variable: the independent variable in this experiment is the volume of air we put into the gas container because we get to chose how the amount of gas we want to have. We measure this variable in mL.
Dependent variable: the dependent variable in this experiment is the pressure as it changes depending on the changes in the volume. We measure this variable in hPa.
Control variable: in this case, we were told to maintain the temperature as stable as possible and so we kept it within 21ºC and 21,5ºC. This variable is measured in ºC. Another one is the atmospheric pressure (as it is the pressure we always start with). This variable is measured in hPa. The initial amount of air we have (65 mL if we want to test the positive pressure values and 20 mL if we want to test the negative ones).

Materials:
- Gas Law Apparatus.


- Computer.

Procedure:
1.- Open an Excel file on your computer. Prepare three columns: volume (measured in mL*), pressure (measured in hPa*) and temperature (measured in ºC*).
* Al these units are the ones shown in the Gas Law Apparatus. If these are not the units you have you might need to change them.

In order to obtain positive pressure values:
2.1-  Turn the clamping handle until it reaches the 65 mL.
3.1- Open the crank handle so that air, composed mainly of oxygen but mostly of nitrogen, can come in.
4.1- Once you have the 65 mL of air, close the crank handle.
5.1- Start turning the clamping handle and stop every 2 mL, in order to measure the results as accurately as possible.
6.1- As said before, stop every 2 mL and write down the corresponding volume, pressure and temperature.
7.1- Make a table in the Excel file with the corresponding data.
______________________________________________________________________________
In order to obtain negative pressure values:
2.2.- Turn the clamping handle until it reaches the 20 mL though it should already be there.
3.2.- Open the crank handle so that air can come in.
4.2.- Once you have the 20 mL of air, close the crank handle.
5.2.- Start turning the clamping handle and stop every 2 mL, writing down the corresponding volume, pressure (remember that you should obtain negative values) and temperature.
6.2.- Make a table in the Excel file with the corresponding data.
_________________________________________________________________________________
8.- Repeat these two procedures as many times as you can so that you achieve a better result.
9.- In order to process the data, make two tables, one for the positive pressure values and another one for the negative ones, and the two corresponding graphs**.
** In order to obtain a lineal function you have to change the volume variable into the inverse of the volume (1/volume).

Processing Data:
Table 1: table showing the relation between the volume (measured in mL) and the pressure (measured in hPa) of air starting with an initial volume of 65 mL.


Table 2: table showing the relation between the volume (measured in mL) and the pressure (measured in hPa) of air starting with an initial volume of 20 mL.


Table 3: table showing the relation between the inverse of the volume of table 1 (1/volume) and the pressure (measured in hPa) of air.


Table 4: Table showing the relation between the inverse of the volume of table 2 (1/volume) and the pressure (measured in hPa) of air.


Graph 1: graph showing the lineal relation between the inverse volume of table 3 (1/volume) and the pressure (measured in hPa) of air.


Graph 2: graph showing the lineal relation between the inverse volume of table 4 (1/volume) and the pressure  (measured in hPa) of air.

Video 1: what is and how to use the gas law apparatus.

Video 2: why do we obtain negative pressure values?

Video 3: three gas laws we should know in order to fully understant this experiment.

Video 4: Gas Properties programme.

Conclusion:
The experiment we carried out actually served as a demonstration of Boyle's-Mariotte Law which stated that for a fixed mass of an ideal gas at a constant temperature, the product of pressure and volume is a constant (P·V=K) .
We figured this throughout the experiment and we could also see it in the tendency line represented in the graph where we obtained a regression coefficient of 0,983.
Finally, during this lab session we tried to carry out an adiabatic process, which is why we attempt to keep the heat be constant.

References:

Hyperphysics.phy-astr.gsu.edu (1998). Ideal Gas Law. [online] Retrieved from: http://hyperphysics.phy-astr.gsu.edu/hbase/kinetic/idegas.html

domingo, 10 de febrero de 2013

Experiment 4: Mixing redox couples.

Objective: to observe if any reaction take place when we mix different elements/ compounds that form redox couples.

Materials:
- 3 test tubes.
- CuSO­­(1M).
NiSO­­4.
- Zinc (solid).
- Zn(No3)2
- Copper thread.
- Magnesium (solid).

Procedure:
1.- Take a test tube and pour into it some NiSO­­4.
2.- Take another test tube and pour into it some CuSO­­(1M).
3.- Take the second test tube where the CuSO­­4 is and put into it a piece of zinc. Write down if anything happens (meaning a reaction).
 5.- Take the first test tube where the NiSO­­4 is and put into it some magnesium. Write down if anything happens (meaning a reaction).
6.- Take the third test tube where the zinc nitrate is and put a piece of copper thread into it. Write down if anything happens (meaning a reaction).


Collecting data:
As in this experiment we are observing if any reaction takes place between a compound and an element and no reaction has taken place, we cannot make a table or a graph with the results so we make videos anyway we've written down the different equations for the reactions taking place:
1st test tube: NiSO4(aq) + Mg(s) --> Ni(s) + MgSO4(aq)
2nd test tube: Zn(s) + CuSO4(aq)--> ZnSO4(aq) + Cu(s)  
3rd test tube: Zn(NO3)2(aq) + Cu(s) = Cu(NO3)2(aq) + Zn(s)


Conclusion:

Experiment 2: Different tests.


Note: Just a couple weeks ago we were grouped in pairs and each pair was given three different compounds so they could carry out the same tests with each of the substances. As we are two pairs we have six substances although we will share the results of all our class.

Objective: to test several characteristics (smell, colour, shiness, aggregation state, melting point, boiling point, magnetism, combustibility, solubility in water, solubility in organic solvent, reactivity VS. water, reactivity VS. base, reactivity VS. acid, pH in aqueous solution and conductivity) of certain element/compounds.

Materials:
- Three different compounds/elements per pair.
- Bunsen burner.
- 6 test tubes.
- Test tube holder.
- Magnet.
- Lighter.
- Water.
- Organic solvent.
- Base.
- Acid.
- Stirring rod.
- Spatula.
- pH indicator paper.
- Safety goggles.
- Porcelain pot.
- Thermometer.

Procedure*:
--------------------------------Put on your safety goggles and your lab coats.---------------------------------
SMELL:
1.- Ask the teacher if it is safe for you to smell the compound/element. If it is safe write down whether the smell is none, mild or strong. If it is not safe for you to smell the compound/element the teacher should inform you if it is either, mild or strong.

COLOUR:
1.- Write down the colour of the compound/element or if it’s colourless.

SHINE:
1.- With the help of the light see if it shines (only applicable for solids and if it’s a metal make sure you scratch a bit the surface or you break it into pieces to see if it’s actually shiny in the inside).

AGGREGATION STATE:
1.- Write down if the compound/element is solid, liquid or gas.

MELTING/ BOILING POINT:
[We have not performed this in the lab as it is a dangerous process plus some substances we were using had really high boiling points which could not be reached with equipment in the lab. Although, if we were to perform it, we should follow the next steps:
1.- Put some of the compound/element into the test tube.
2.- Connect the bunsen burner to the gas and turn the gas on.
3.- Open the bunsen burner and lit it up.
4.- Heat up the test tube with the bunsen burner flame. The test tube must be tilted but make sure there’s nobody near you when doing so.
5.- In order to record the temperature at which it melts/boils you could use a thermometer, if the temperature is low, or a temperature sensor, if the temperature is higher but not too high.]

MAGNETISM:
1.- Take the magnet and a little bit of each compound/element. Put the magnet near it and see if the compound/element moves or is attracted towards the magnet.


COMBUSTIBILITY:
1.- Place a bit of the compound/element on the porcelain plate.
2.- Turn on the burner.
2.- Set fire to the element/ compound ( before doing so make sure there are no organic compounds in the table nearby where you are performing the experiment). In case it burns you need to make a note on how the flame is (the colour it has, its height...)

SOLUBILITY IN WATER/ REACTIVITY VS WATER/ pH IN AQUEOUS SOLUTION:
1.- Take the compound/ element and pour it into a beaker with water. Observe if any reaction between the water and the solute takes place. If there is any take note.
2.- With the help of a stirring rod, mix the two parts of the solution. If they cannot be mixed, the solute is not soluble in water.
3.- If you have obtained a solution, cut a bit of indicator paper and touch with it the solution. Write down the pH it indicates by the colour it turns to.

SOLUBILITY IN ORGANIC SOLVENTS:
1.- Pour some of the element/ compound into the test tube.
2.- Choose any organic solvent you have at your disposal (like, for example propanol or butanol) and pour some of it into the test tube.
3.- Write down if they mix or not (you may need the help of a stirring rod to be sure).

REACTIVITY VS OH- (base)
1.- Pour part the base (OH- ) in a test tube.
2.- Introduce the component/compound, in order to see if it reacts or not.

REACTIVITY VS H+
1.- Pour part the acid (H+) in a test tube.
2.- Introduce the element/compound, in order to see if it reacts or not.


CONDUCTIVITY:
1.- Take each of the element/compound and put them, if they are solid, on the porcelain pot or, if they are liquid, in a test tube.
2.- Take the conductivity tester and touch with the ends of it the element/compound. If the bulb lights up, the element/compound conducts electricity, if not, it doesn’t conduct electricity.


* As in this experiment we are testing different characteristics of the compounds/elements you don't have to follow a fixed order like you should in other meaning that the order in which you carry out the test doesn't matter but you must follow the steps in each single test.

PROCESSING DATA:

Table 1: table showing the different compounds/elements of which we (meaning all the students in our class) have tested the different characteristics.


VIDEOS:
Video 1: First part collecting all the test we carryed out.


Video 2: Second part collecting all the test we carryed out.

Video 3: Reaction of sodium and water.

CONCLUSION:
In the conclusion we would want to discuss several points:
- During the performance of this experiment we wrote down some results that we did not expect. Like the fact that four of our six elements/compounds didn't dissolve in water or that some of them didn't combusted when we expected they will do so.
- The performance of this experiment has not been as difficult as others could be but it has been very tedious as it was a very long experiment because we needed to test several things of many different elements/ compounds.
- We think that if we perform the experiment in another occasion we would be much faster and accurate as we would know what is better to be done after what and how to do things correctly.

Experiment 3: Redox Titration

Objective: to determine the minimum amount of MnO4 necessary to make a reaction with potassium.

Materials:
- Burette.
- Clamp.
- Erlenmeyer flask.
- Vertical stand.
- Measuring pipette.
- Test tube with Sulphuric acid (2 M).
Potassium permanganate.
- Oxygenated water.


Method:

1. Set up the materials as shown in the image below(place the clamp on the stand and attach the burette to the clamp).


2. Pour the permanganate into the burette carefully (make sure the stopper of the burette is horizontal before doing so). It would be fitting to fill it up untill 1 instead of 0 as the compound we are using is really dark and it’s very difficult to adjust it to 0 as you can’t see the number clearly.
3. Put a beaker below the burette and open the burette letting some KMnO4 pass through until the bottom part of the burette is filled.
4. Adjust the level of potassium permanganate up to 1.
5. Use the pipette to take 10 mL of oxygenated water (H202) and pour it into the 100 mL Erlenmeyer flask.
6. Call your teacher and ask him to add some 2M Sulphuric acid (HCL) to the H202.
7. Place the Erlenmeyer flask under the burette and slowly, let the KMnO4 pass through, while doing this, shake slightly the flask.
8. Repeat the process in step 7, until the solution remains purple when mixed with the KMnO4.


9. Place the stopper in a horizontal position, and record the level of KMnO4 in the burette.

And now a couple videos explaining the procedure and the different results you can obtain from this experiment:

Video 1: the procedure of the experiment.


Video 2: the different results you can obtain in this experiment.

Video 3: redox reaction between HCl, KMnO4 and H202.

Video 4: explanation of the redox equation


CONCLUSION:
At first, we thought that we will need more KMnO4 in order to see the reaction happen but as we performed the experiment, we saw that the amount of KMnOneeded was not higher than 26 mL. Maybe, for that reason, the fact we thought that more KMnO4 was needed, we added two much and the second reaction (when it turns into a brownish colour) took place far too fast. 
In addition, we think that if we weren't running out of time when we performed the final part of the experiment, we could have had obtained a more accurate result because we would have had time to pour the KMnO4 slower to see when the reaction exactly happened.
Either way, we reached a good result as the amount of KMnO4 needed to make the reaction happen was 25,5 mL and we used 26,6 mL, so it is a good result indeed.